


Our Algorithm
We coded everything in Jupyter Notebook. We used the scikit learn and heartpy libraries.
Our Machine Learning Pipeline consists of: Filtering and smoothing the ECG and SCG signal, extracting features from the x, y and z-axis accelerometer and using 3 classifiers (Decision Tree, K-Nearest Neighbor, and Naïve Bayes) and the data being tested and trained via 80/20 split train test or 25 cross-fold validation.
More Detail on Feature Extraction
We filtered the ECG and SCG signal with a notch filter to remove any baseline wander present in the data. Then we smoothed the ECG signal using the savitzky-golay filter. Next, we extracted the frame features from the accelerometer data using mean and variance.
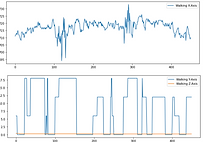
ECG and SCG Signal
A lot of useful information can be obtained from the ECG and SCG signals. There are a significant number of time intervals that contain useful information we can use. Specifically, the RAC interval can be used to estimate Blood Pressure. You can see our data matches with expected signals. More information on them can be found here.
Code and Data
All raw unannotated data from the app can be found here.
All raw annotated subject specific data can be found here.
All raw annotated combined subject data can be found here.
All processed annotated combined subject data can be found here.
All code can be found here.